News•Viewtracker - Analytics for Confluence
Viewtracker Templates and Label-Based Filtering
How to use Space Analytics Report Templates and filtering by labels with Viewtracker.
Aug 12, 2024
Our developers have been busy bees 🐝 for the latest releases of Viewtracker. These releases introduce a range of exciting features that provide deeper insights into user engagement, page versions, improved navigation and collaboration. This post will walk you through these new features and their benefits. Let’s dive in!
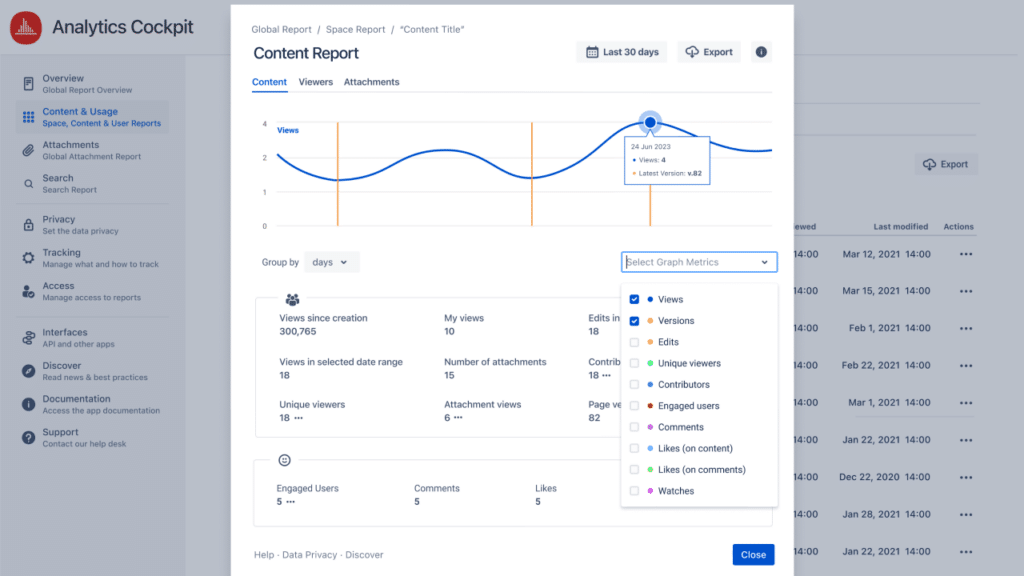
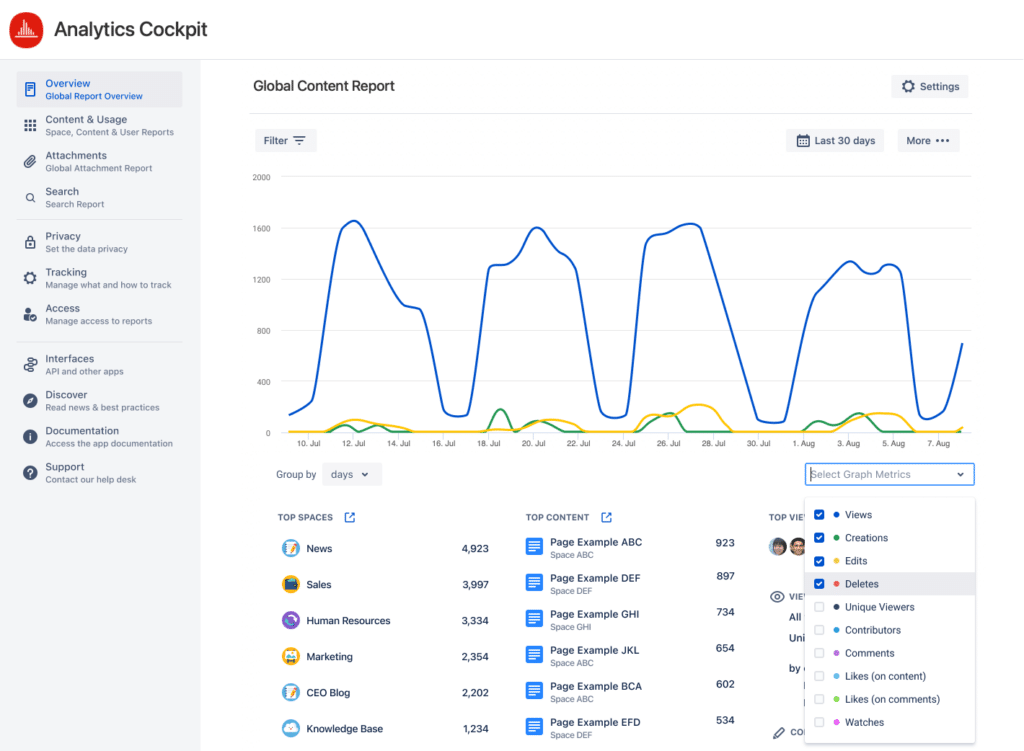
Viewtracker now lets you specify which metrics should be displayed in the line charts of your reports. Do you want the graph to include views, unique viewers, contributors, or other relevant metrics? You can customize the line charts via the “Select Graph Metrics” menu to showcase the data that matters most to you. Viewtracker will save the selection for the next time you access the report. Each report has its own set of graph metrics, making sure that only the relevant metrics are present.
What is more, you can group the graph metrics by days, weeks, months or years.

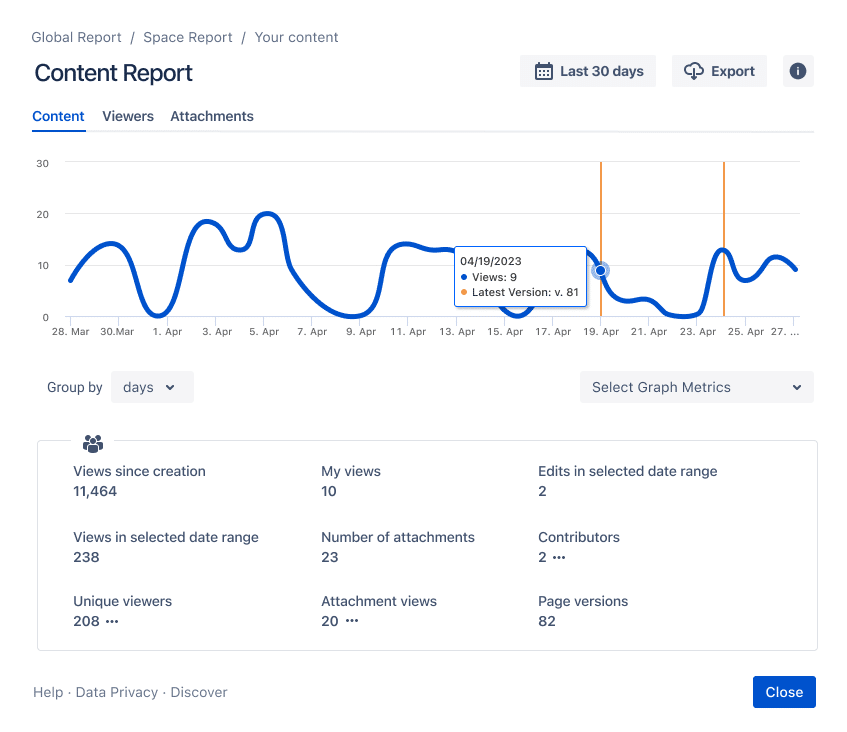
Keeping track of page versions is crucial for maintaining an organized and up-to-date Confluence space. With the Content Report line chart, you can now easily identify when new page versions were published. This feature visually represents the publishing activity, empowering you to monitor content updates and ensure that information is accurate. Versions are represented as vertical lines in the graph and are visible by default. As mentioned above, you can always adapt the metrics via the “Select Graph Metrics” menu.

Viewtracker now features convenient breadcrumb navigation, allowing you to effortlessly switch between Content Report, Space Report, and Global Report. With a simple click, you can navigate seamlessly through different levels of reporting, providing you with a holistic view of your Confluence usage. This streamlined navigation saves you time and enhances your overall experience when exploring the analytics of your Confluence instance.

We understand the importance of maintaining context when switching between different reports. With the latest version of Viewtracker, the selected date range is respected when transitioning from one report to another. You no longer need to re-select your desired date range, ensuring a consistent view of your data. This makes it easier to analyze trends and patterns across different reports.
Efficient collaboration is at the heart of Viewtracker, and we’ve enhanced the sharing capabilities of reports with this in mind. Applied filters in Viewtracker reports are now reflected in the URL parameters. This means that when you share a report with others who have the same permissions, they will see the report with the same filters already applied. This feature streamlines collaboration, allowing teams to analyze and discuss data more productively.
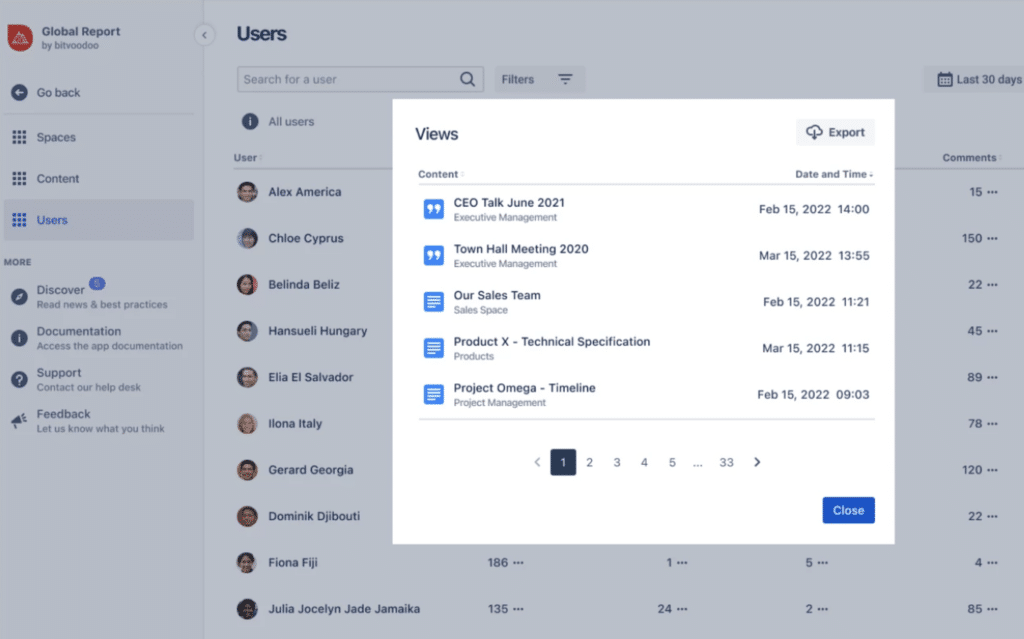
Understanding how users navigate and interact with Confluence is crucial for any Confluence administrator and team lead. In the latest Content & Usage Users Report version, you gain direct access to a comprehensive list of pages with which a specific user has interacted.

The latest version of Viewtracker Cloud & Data Center enhances navigation, collaboration, and reporting in Atlassian Confluence. Features like customizable line charts and page version tracking empower you to gain deeper insights into your Confluence usage. Thanks to the breadcrumb navigation, consistent date range selection, and the option to share filtered reports, you can seamlessly explore different reports and collaborate with teammates.
Upgrade to the latest version of Viewtracker today to make use of these powerful features. The changes are also reflected in the Viewtracker On-Premise and Cloud documentation.
If you have any questions or need assistance, our dedicated support team is ready to help. Stay tuned for future updates as we continue to enhance Viewtracker by delivering innovative features.